Trade Agreement Documents Clustered by Topic
Static Visualisation:
Agreement Documents Clustered by Topic

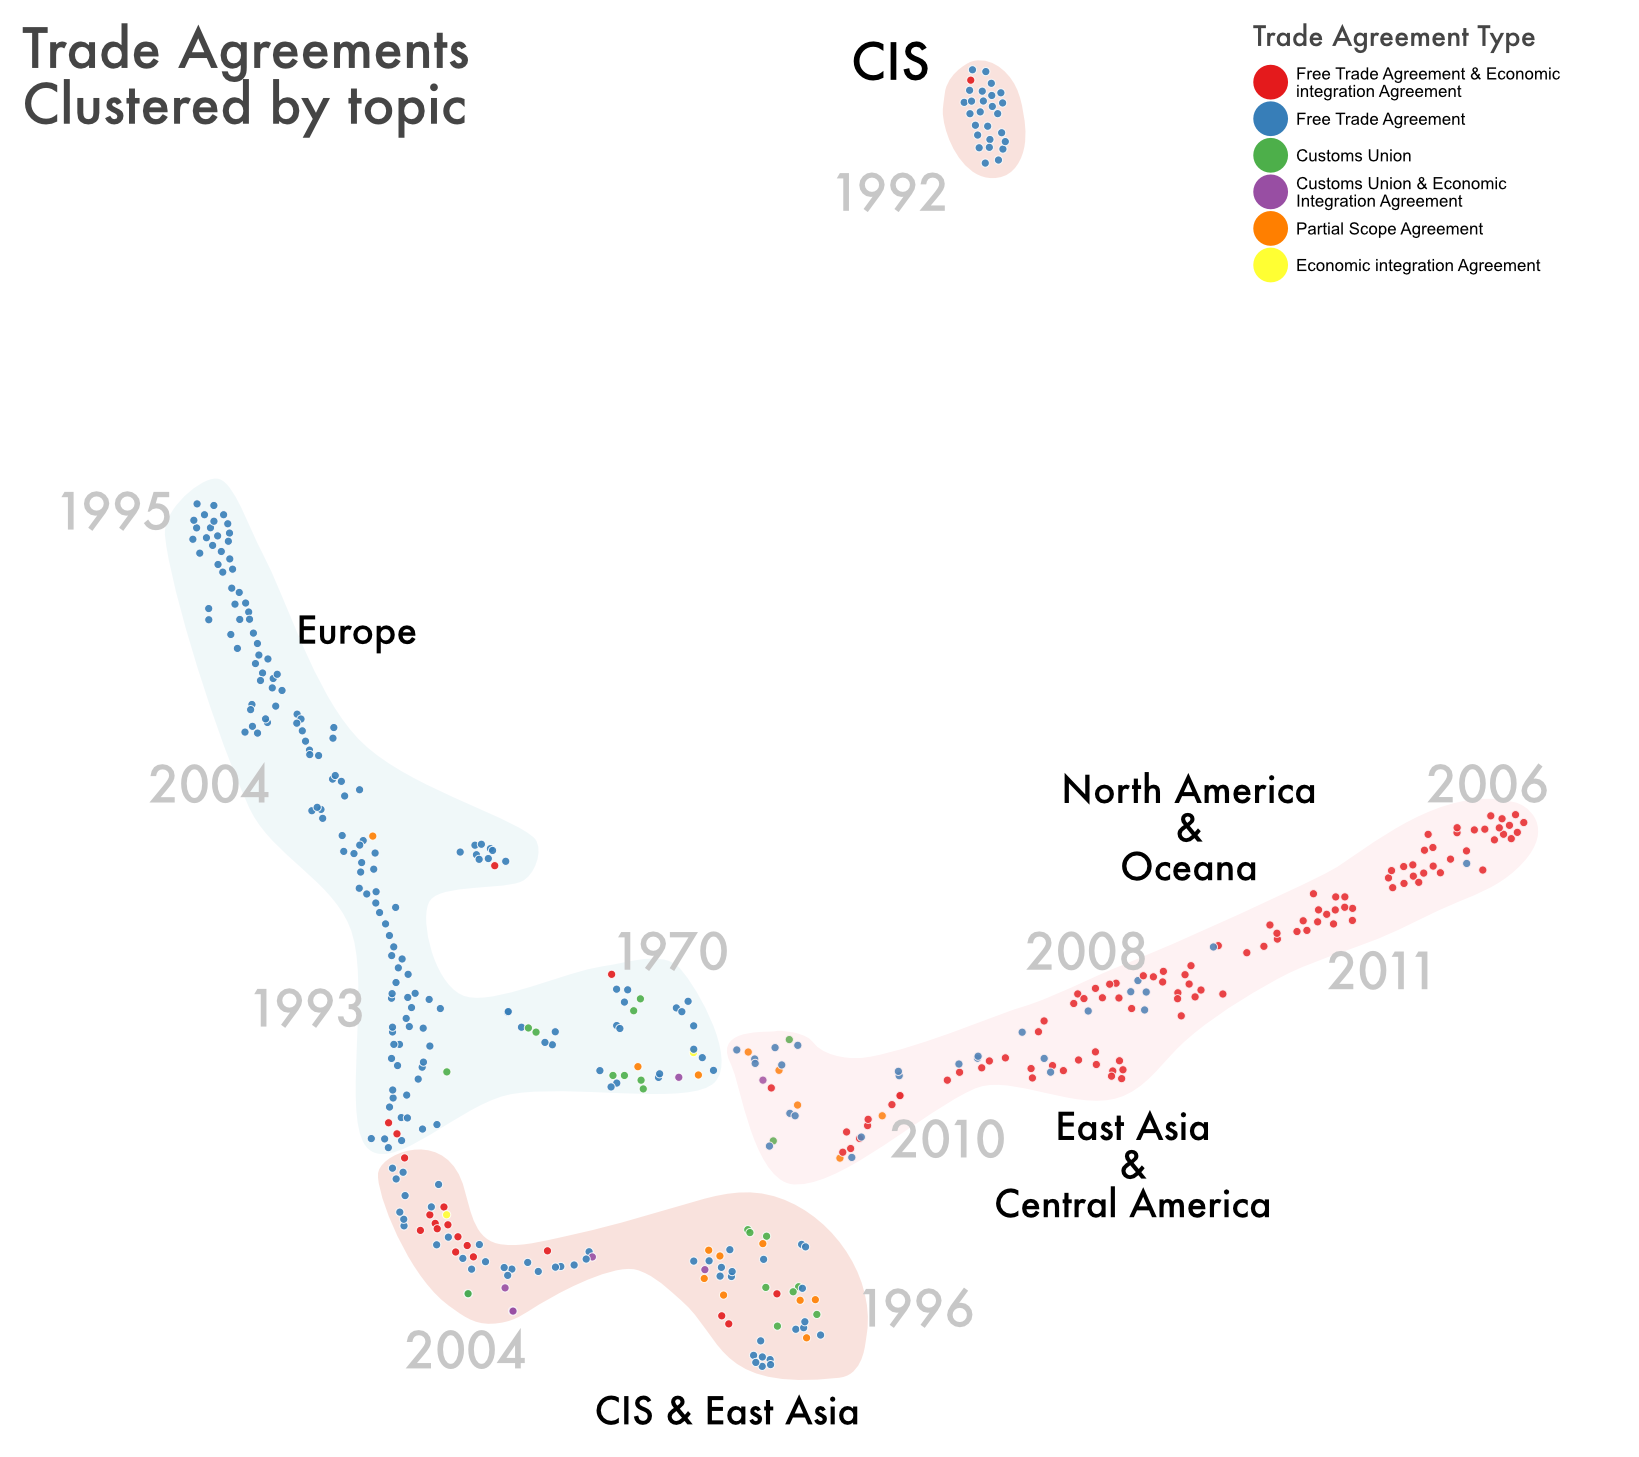
Each point represents a trade agreement between one or more countries, the colour represents the type of trade agreement. The agreements have also been analysed and the average year the treaties were signed for each cluster shown. Furthermore, The general regions which treaties are a part of is also shown.
The types of trade agreements can be roughly separated along continental lines, meaning that European countries seem to prefer free trade agreements, while North America and East Asia seem to prefer free trade and Economic integration agreements. A third cluster exists, where the commonwealth of independent states seem to predominantly trade with one another using a variety of trade agreement types.
This visualisation also shows that trade agreements are changing over time, both within types as well as between types.
Interactive Visualisation:
Agreement Documents Clustered by Topic
This interactive visualisation uses the same data as above however, the clusters are slightly different due to random fluctuations in the clustering algorithm. The colour represents the agreement type, point size represents the length of the treaty and like above the position represents the relative similarity of the trade agreements. This is an interactive visualisation so you are free to explore and investigate clusters. Additional data is presented when you hover over a point.